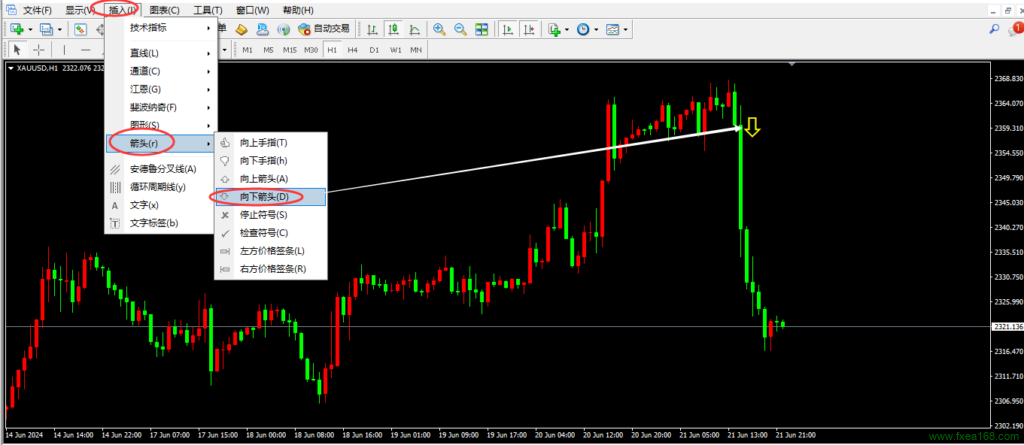
在MetaTrader 4 (MT4)中,图形对象的使用对于技术分析和市场可视化非常重要。本文将详细介绍如何通过MQL4编程在图表上创建和操作“向下箭头”图形对象,并提供相应的代码示例和技术扩展。

创建和操作“向下箭头”图形对象的步骤
在MT4中,通过MQL4脚本绘制和操作“向下箭头”图形对象需要以下几个步骤:
准备脚本
首先,创建一个新的MQL4脚本,并设置必要的脚本属性和输入参数:
#property strict
#property description "Script draws \"Arrow Down\" sign."
#property script_show_inputs

input string            InpName="ArrowDown";     // 标记名称
input int               InpDate=75;              // 锚点日期,百分比
input int               InpPrice=75;             // 锚点价格,百分比
input ENUM_ARROW_ANCHOR InpAnchor=ANCHOR_BOTTOM; // 锚点类型
input color             InpColor=clrRed;         // 标记颜色
input ENUM_LINE_STYLE   InpStyle=STYLE_DOT;      // 边线样式
input int               InpWidth=5;              // 标记大小
input bool              InpBack=false;           // 背景标记
input bool              InpSelection=false;      // 可移动
input bool              InpHidden=true;          // 隐藏在对象列表中
input long              InpZOrder=0;             // 鼠标点击优先级
创建“向下箭头”图形对象
为了创建“向下箭头”图形对象,我们需要定义一个函数,该函数将处理对象的创建和属性设置:
bool ArrowDownCreate(const long chart_ID=0, const string name="ArrowDown", const int sub_window=0, datetime time=0, double price=0, const ENUM_ARROW_ANCHOR anchor=ANCHOR_BOTTOM, const color clr=clrRed, const ENUM_LINE_STYLE style=STYLE_SOLID, const int width=3, const bool back=false, const bool selection=true, const bool hidden=true, const long z_order=0) {
    ChangeArrowEmptyPoint(time, price);  // 设置锚点坐标
    ResetLastError();  // 重置错误值
    if (!ObjectCreate(chart_ID, name, OBJ_ARROW_DOWN, sub_window, time, price)) {
        Print(__FUNCTION__, ": failed to create \"Arrow Down\" sign! Error code = ", GetLastError());
        return false;
    }
    ObjectSetInteger(chart_ID, name, OBJPROP_ANCHOR, anchor);  // 设置锚点类型
    ObjectSetInteger(chart_ID, name, OBJPROP_COLOR, clr);  // 设置标记颜色
    ObjectSetInteger(chart_ID, name, OBJPROP_STYLE, style);  // 设置边线样式
    ObjectSetInteger(chart_ID, name, OBJPROP_WIDTH, width);  // 设置标记大小
    ObjectSetInteger(chart_ID, name, OBJPROP_BACK, back);  // 设置背景标记
    ObjectSetInteger(chart_ID, name, OBJPROP_SELECTABLE, selection);  // 设置可移动
    ObjectSetInteger(chart_ID, name, OBJPROP_SELECTED, selection);  // 设置选中状态
    ObjectSetInteger(chart_ID, name, OBJPROP_HIDDEN, hidden);  // 设置隐藏状态
    ObjectSetInteger(chart_ID, name, OBJPROP_ZORDER, z_order);  // 设置鼠标点击优先级
    return true;
}
移动“向下箭头”图形对象
接下来,定义一个函数来移动“向下箭头”图形对象的锚点位置:
bool ArrowDownMove(const long chart_ID=0, const string name="ArrowDown", datetime time=0, double price=0) {
    if (!time)
        time = TimeCurrent();
    if (!price)
        price = SymbolInfoDouble(Symbol(), SYMBOL_BID);
    ResetLastError();  // 重置错误值
    if (!ObjectMove(chart_ID, name, 0, time, price)) {
        Print(__FUNCTION__, ": failed to move the anchor point! Error code = ", GetLastError());
        return false;
    }
    return true;
}
删除和修改“向下箭头”图形对象
如果需要删除图形对象,可以使用以下函数:
bool ArrowDownDelete(const long chart_ID=0, const string name="ArrowDown") {
    ResetLastError();  // 重置错误值
    if (!ObjectDelete(chart_ID, name)) {
        Print(__FUNCTION__, ": failed to delete \"Arrow Down\" sign! Error code = ", GetLastError());
        return false;
    }
    return true;
}
修改锚点类型的函数如下:
bool ArrowDownAnchorChange(const long chart_ID=0, const string name="ArrowDown", const ENUM_ARROW_ANCHOR anchor=ANCHOR_TOP) {
    ResetLastError();  // 重置错误值
    if (!ObjectSetInteger(chart_ID, name, OBJPROP_ANCHOR, anchor)) {
        Print(__FUNCTION__, ": failed to change anchor type! Error code = ", GetLastError());
        return false;
    }
    return true;
}
脚本启动函数
在脚本启动时,我们需要验证输入参数的有效性,并创建“向下箭头”图形对象:
void OnStart() {
    if (InpDate < 0 || InpDate > 100 || InpPrice < 0 || InpPrice > 100) {
        Print("Error! Incorrect values of input parameters!");
        return;
    }

    int bars = (int)ChartGetInteger(0, CHART_VISIBLE_BARS);
    int accuracy = 1000;
    datetime date[];
    double price[];
    ArrayResize(date, bars);
    ArrayResize(price, accuracy);

    ResetLastError();
    if (CopyTime(Symbol(), Period(), 0, bars, date) == -1) {
        Print("Failed to copy time values! Error code = ", GetLastError());
        return;
    }

    double max_price = ChartGetDouble(0, CHART_PRICE_MAX);
    double min_price = ChartGetDouble(0, CHART_PRICE_MIN);
    double step = (max_price - min_price) / accuracy;
    for (int i = 0; i < accuracy; i++)
        price[i] = min_price + i * step;

    int d = InpDate * (bars - 1) / 100;
    int p = InpPrice * (accuracy - 1) / 100;

    if (!ArrowDownCreate(0, InpName, 0, date[d], price[p], InpAnchor, InpColor, InpStyle, InpWidth, InpBack, InpSelection, InpHidden, InpZOrder))
        return;

    ChartRedraw();
    Sleep(1000);

    int v_steps = accuracy / 2;
    for (int i = 0; i < v_steps; i++) {
        if (p > 1)
            p -= 1;
        if (!ArrowDownMove(0, InpName, date[d], price[p]))
            return;
        if (IsStopped())
            return;
        ChartRedraw();
    }

    Sleep(1000);

    ArrowDownAnchorChange(0, InpName, ANCHOR_TOP);
    ChartRedraw();
    Sleep(1000);
    ArrowDownDelete(0, InpName);
    ChartRedraw();
    Sleep(1000);
}
结语
通过以上代码示例和详细步骤,我们可以在MetaTrader 4中成功绘制和操作“向下箭头”图形对象。这不仅增强了图表的可视化效果,还为交易者提供了更多的市场分析工具。通过深入理解和灵活运用这些MQL4编程技巧,交易者能够更好地定制自己的交易策略和图表分析工具,从而提高交易效果。
 ea编程网
ea编程网


